 By Richard Boire
During these difficult times as businesses strive to stay afloat, thoughts of analytics and their impact have become a lower priority for many organizations. Yet, it is during these times that analytics is even more important. The ability to use data for more effective decision-making has fundamentally always been about ROI optimization. One would think that during these difficult times as cash flow and costs become even more paramount, there requires an even more laser-liked approach towards the use of data.
Loyalty programs which have always been at the forefront of using data and pioneers in this area such as Loyalty One (Air Miles) have demonstrated how they use data to essentially achieve marketing’s overarching goal of targeting the right consumer with the right offer at the right time. Predictive analytics and other advanced analytical techniques have been used rigorously in their efforts to achieve this goal. But recognizing the increased value of analytics in these times, we also recognize that data is at the core of all analytical exercises. But does COVID-19 change our analytics exercises and what does this mean for loyalty marketers. Let’s explore this more closely.
When we talk about change because of COVID-19, the marketer’s first reaction is whether consumer behaviour has changed. But marketers and businesses in general understand this to be the reality. For the loyalty analytics practitioner, the initial reaction is whether or not the data has changed. In other words, how does the data impact the analysis such that different business decisions are made. These decisions can arise from two areas:
• Reporting
• Targeting of customers
In reporting, the analyst is often asked to produce information that conveys a visual narrative about a theme that is relevant for that organization. For example, let’s look at the average loyalty customer spend by region in the last 12 months. We are already aware that the data consists of spend prior to COVID-19 spend and spend during COVID-19. It is not a great intellectual leap to surmise that different regions are being impacted differently by COVID-19. For example, let’s look at two different regions such as Quebec and the Maritimes. We already know that COVID-19 has had a much more deleterious impact in Quebec than the Maritimes. Looking at a 12-month report, we might observe the following:
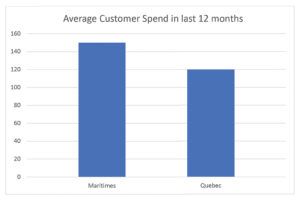 From Chart 1, we might conclude here that customer spend is higher in the Maritimes, but let’s look at an even more granular breakdown of these numbers overtime.
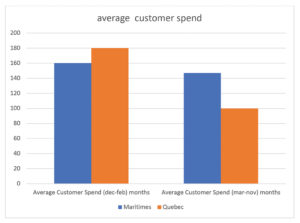 Chart 2 reveals a different story in that the pandemic (March-November) has significantly altered loyalty behaviour. Looking at the numbers prepandemic and during pandemic, we observe that loyalty behaviour in normal times seems to be higher in Quebec but then lowers significantly because of the pandemic. But let’s more closely observe and see what is happening during the entire pandemic period.
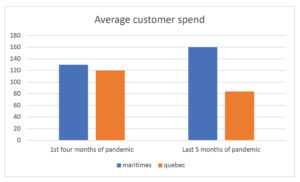 Chart 3 is even more revealing in that the most recent months of the pandemic have seen a rise in customer spend in the Maritimes while the opposite is occurring in Quebec. One could conclude that loyalty behaviour is on the rise in the Maritimes while Quebec loyalty behaviour continues to erode.
The point of these above examples and charts is to demonstrate the sensitivity of looking at historical behaviour during these most unusual times. This customer behaviour instability is further amplified when we look at tools to target customers. Let’s look at the most basic tool which is RFM.
Targeting of customers represents the capability of rank ordering or differentiating of customers based on a desired behaviour. Tools exist which consist of the most basic such as RFM (recency of purchase, frequency of purchases, and monetary value of purchase) towards the more advanced ones such as deep learning or artificial intelligence. But if the end objective is ranking of customers, then does this ranking change with significant environmental changes such as a pandemic. In order to understand this concept, one must explore migration behaviour with regards to their RFM rank. Let’s say we rank customers into 5 overall groups based on RFM with 5 being the best and 1 being the worst.
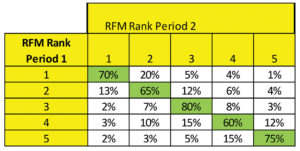 Let’s look at the Chart 4: Assume that average customer spend in period 1 is $100 but then drops to $50 in period 2. In the chart above, we can see that the RFM ranks are stable in that the customer maintains the same ranking and very few customers migrate to completely different ranks. So even though overall customer spend has declined in period 2, the RFM ranking has remained consistent between both periods. But now let’s take another example where significant change is occurring in terms of migration.
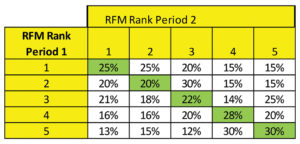 Chart 5 indicates no stability in terms of RFM migration behaviour. As expressed above, these migration reports would indicate that we would need to identify periods in time (period 1 and period 2) where the migration behaviour is stable as we saw in Chart 4.
Once again, the purpose of these charts is to lock in on periods of time when we are observing stable consumer spend behaviour. To put this in a practical perspective, suppose two consumers were in the top RFM rank of 5 before the pandemic. Yet, consumer A is still rank 5 after the pandemic while consumer B is now rank 1. Essentially, what we want to do is find periods of time where consumer A and consumer B remain in rank 5 for both periods. As one can see, even basic tools such as RFM can produce unstable results depending on the period of time. What about the more advanced tools, such as predictive models, which include deep learning? Let’s explore this in more detail.
With models, we are attaching weight to various variables in a given model and the more advanced these tools are, the more sensitive the weights are to the data. This would suggest that the use of deep learning tools (AI) which are the most advanced would be subject to inaccurate weights particularly if we are looking at the last 12 months. The problem here is that we are assuming that these variable weights as determined from the recent past reflect what will happen in the future which is a very false assumption in such a highly dynamic data environment. But one idea worth exploring is to use the notion of RFM ranks as seen above to determine a stable period of time and then build the more advanced analytics tools within this defined stable period of time.
These are challenging times in conducting analytics as it relates to consumer and loyalty behaviour and increased cost sensitivity just reinforces the need for analytics. More vigilant practices in reviewing the data is key to success in working in this type of environment. More pragmatic approaches to data analytics should be emphasized such as RFM. The use of more advanced tools such as deep learning must recognize the issue of data instability as their ability to predict behaviour in this type of environment can be a recipe for failure. Prudent review of the data by data scientists can provide the direction for when these more advanced tools will be most applicable. As with all data analytics exercises, they begin and end with the data.
Richard Boire is the President of Boire Analytics in Pickering, Ontario and is one of Canada’s premier experts on data analytics.
Related Posts