Inside the Selzy Study and Beyond
In the U.S., Email remains the dominant outbound marketing channel with a 78 percent usage rate, and industry-specific benchmarks reveal key trends and performance insights. The Canadian market has always shown similar numbers, which means the new study by Selzy provides a reasonable guideline for Canadian firms. The comprehensive analysis of email marketing performance across various industries. By examining over 40 billion emails sent by Selzy users between 2020 and 2024, the research uncovers trends, effectiveness, and industry-specific benchmarks that are crucial for marketers to understand.
The study indicates that email marketing continues to be a pivotal tool for businesses, with an increase in adoption and performance metrics across most industries. Data from the study highlights how different sectors are leveraging email marketing, and what trends are emerging as crucial for success.
Key Findings:
● Dominance of Email Marketing: Email maintains its position as the leading channel for outbound marketing, with a 78 percent usage rate, reflecting a 15 percent increase over the past year.
● Deliverability Rates: Average deliverability rates have improved, rising from 94.26 percent in 2020 to 96.43 percent in 2024. The Tourism & Travel and Nonprofit sectors lead with rates exceeding 98 percent.
● Bounce Rates: The overall average bounce rate was 1.98 percent, with the Marketing, E-commerce, and Media & Publishing industries experiencing the highest bounce rates.
● E-commerce Growth: The e-commerce industry saw the most significant improvement in deliverability rates, with a 10.28 percent increase, alongside a 0.7 percent reduction in bounce rates.
● Open Rates Trends: Despite a slight decline in total open rates (-8.6 percent) since 2020, there has been a notable increase (17.8 percent) between 2021 and 2023. Media & Publishing observed a substantial growth of 60.8 percent following a dip in 2021.
● Unsubscribe Rates: In 2023, unsubscribe rates significantly decreased in the Education and Marketing sectors by 35 percent and 35.7 percent, respectively.
● Spam Rates: The overall spam rate saw a notable reduction of 44.4 percent in 2023 compared to 2020, indicating improved email practices across industries.
The key to email marketing success
This report compared email performance rates. By looking at different industries over the past four years (2020-2023), we found out something important: understanding how users behave is really important for success.
Benchmarks are a good starting point. The next step is to watch trends and figure out what depends on what. You need to always be paying attention to how user behavior changes because of things like the economy and world events. These small and fast-changing trends can be hard to keep up with.
To stay ahead of the curve, data is your most valuable tool. Using data analytics, businesses can find out what customers want and adapt to their changing preferences. You can get real-time insights and keep track of bigger trends that might influence user behavior.
Using data and being flexible, you can make a dynamic email marketing system that connects with your audience and gets consistent results.
The research analyzed over 40 billion marketing emails sent by Selzy users from 2020 to 2024. Industry averages from different sources were also reviewed, focusing on sectors where Selzy has sufficient data to make reliable conclusions. The study evaluated email performance trends over the 2020-2024 period, providing a thorough understanding of how email marketing has evolved.
To present a comprehensive picture of email performance across different industries, public data from 2023 and Selzy’s data from 2020 to 2024 were utilized. The analysis included industry and business reports, along with research from respected sources like Statista, Litmus, Accenture, Grand View Research, and academic journals. This combination of data and expert insights offers valuable recommendations for improving email marketing strategies across various industries.
It is important to note that these are average metrics. The success of an email campaign can vary significantly based on factors such as domain reputation, quality of contact lists, email content, and more. Additionally, differences in data collection methods among publications may have influenced the findings.
Benchmarks are your compass to navigate email marketing
To gain a competitive advantage, industry, and regional benchmarks continuously come in handy to analyze email marketing effectiveness within the broader landscape.
Benchmarks provide performance guidelines:
Improvement areas identification and progress tracking against industry best practices and specific nuances over time.
Realistic goals and strategy refinements to stay competitive in the ever-evolving digital marketing.
Decisions based on regional and industry customer preferences to increase engagement and conversions.
Targeted adjustments to the strategy with metrics comparison (open rates, click-through rates, etc.) to industry averages and standards.
To get a leg up on the competition, industry and regional benchmarks are really useful for figuring out how well your email marketing is doing compared to the bigger picture.
Benchmarks help you:
Figure out where you can improve and track your progress compared to the best practices in your industry and any unique things that change over time.
Set realistic goals and adjust your strategies to stay ahead in the constantly changing world of digital marketing.
Make decisions based on what customers in your area and industry like to do so you can get more people involved and make more sales.
Change your strategy based on how your metrics compare (open rates, click-through rates, etc.) to the average and standards in your industry.
Email is still a powerful tool when used with other marketing efforts. Email makes up over 80 percent of outbound messaging. (Salesforce)
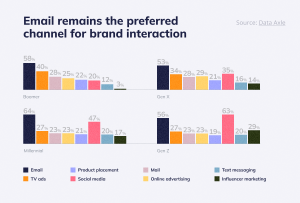
Customers say email is their favorite way to interact with brands. 56 percent of Gen Z use email to talk to brands, and they’re keeping up with other generations. (Data Axle)
Email remains the preferred channel for brand interaction
Because email is still important and reliable, it’s really important to look at your email marketing strategy and make it better so you can succeed for a long time.
Delivery or deliverability?
Delivery rate ( percent) = (Delivered emails / Total emails sent) x 100; Deliverability rate ( percent) = Delivery rate – Spam rate and Bounce rate
While both provide information on how your emails are getting to people, there’s a big difference between email delivery rate and email deliverability rate. Email delivery rate shows if an email was sent successfully from the sender to the recipient’s mail server. It doesn’t say if the email went to the inbox, spam folder, or somewhere else. Email deliverability rate looks at the whole email journey. It checks if the recipient’s server took the email and where it ended up in the recipient’s inbox. While both terms relate to getting your emails to recipients, there’s a critical distinction between email delivery rate and email deliverability rate. A good deliverability score means your emails reach inboxes and avoid spam filters. Deliverability has a direct impact on audience engagement.
Why is deliverability important?
Deliverability problems can cost more than $15,000 for every million emails sent according to Validity. Getting to the inbox makes it more likely that people will see and interact with emails, leading to more engagement. Over time, consistently good deliverability builds a good reputation as a sender, which is very important for email marketing success.
Challenges and considerations:
Email service providers like Yahoo and Gmail are always coming up with new ways to fight spam. This means you need to pay close attention to the requirements for validating your domain and avoid things that trigger spam filters when you’re setting up your emails and making content.
Deliverability and delivery rates can change depending on the Email Service Provider (ESP) (e.g., Selzy, HubSpot, etc.) and the Internet Service Provider (ISP) that the recipients use.
A good deliverability score indicates your emails reach inboxes and avoid spam filters. Deliverability has a direct impact on audience engagement.
Bounce rates are increasing. Is it consistent across industries? Email bounce rate is the percentage of emails that weren’t delivered. It helps you understand if there are problems stopping your communication efforts. Bounces happen when emails get sent back to the sender because of delivery problems. There are two main types of bounces: hard and soft.
Soft bounces:
Cause: Temporary problems, like full inboxes, server problems, inactive accounts, and temporary emails.
Outcome: The email isn’t delivered right away but might be delivered later.
Impact: This can hurt the sender’s reputation if it’s not fixed or if it happens often. These issues might fix themselves, but you should keep an eye on them to fix problems quickly. For example, if emails are sent too often, or files are too big.
Hard bounces:
Cause: Permanent problems, like invalid email addresses, domain names, or authentication failures.
Outcome: The email can’t be delivered permanently and won’t be delivered.
Impact: Hurts the sender’s reputation and can cause more problems with email deliverability.
Benchmarking bounce rates: Comparing industry averages, 2020-2023
According to Selzy, bounce rates went down a little by 0.4 percent, going from 5.68 percent in 2020 to 3.55 percent in 2023. The E-commerce and Retail industries saw the biggest improvement in bounce rates of 0.7 percent from 2020 to 2023. In 2023, Agencies/Consulting had the biggest increase of +144,7 percent in bounces, followed by IT with +82.6 percent. Tourism & Travel and E-commerce, on the other hand, were the only two industries showing a decrease in bounce rates. Tourism & Travel is down by 25.8 percent from 2022, E-commerce -28.4 percent from 2022
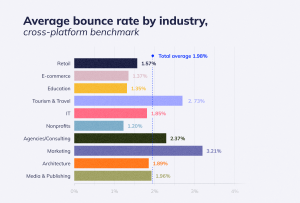
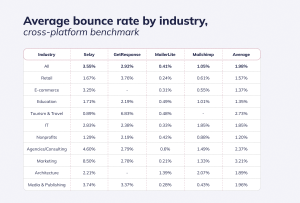
The average bounce rate across all industries is 1.98 percent. Looking at the average bounce rates for each industry shows that Marketing and Tourism & Travel have the highest average bounce rates. In contrast, Nonprofits, Education, and E-commerce have the lowest.
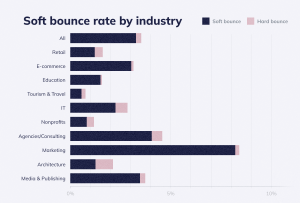 Marketing (97 percent), E-commerce (93 percent) and Media & Publishing (93 percent) have the highest percentage of soft bounces against the overall rate.
Several things might cause this, including:
Email practices specific to each industry. Different industries might have set frequencies and strategies for reaching out through email, which could affect bounce rates.
The demographics of the target audience. The age, location, and how tech-savvy the target audience is can affect email engagement and bounce rates.
How well the email list is managed. Industries that are stricter about keeping their lists clean might have lower overall bounce rates, with soft bounces being more likely to happen because of temporary problems.
Soft bounce rate by industry
Overall, this benchmark shows that soft bounces happen more often than hard bounces, which is good news. The bad news is bounce rates go up over time. Tourism & Travel and E-commerce are the industries to learn from.
Beyond the averages: Exploring email open rates with industry comparisons & unique insights. Email open rate = (Emails opened / Emails delivered) x 10.
The email open rate is the first sign of how engaged people are with your email marketing efforts. It tells you what percentage of delivered emails were opened. This metric shows you how many recipients were interested in your message. Open rates give you useful insights, but there are some key things to keep in mind:
• Multiple opens from the same subscriber or pre-loading of images because of Apple Mail Privacy Protection (MPP) can make the open rate data seem bigger than it really is.
• Open rates make more sense when you look at them along with other metrics like click-through rates and conversion rates. This gives you a better picture of how your campaign is doing.
• Dividing your audience based on their preferences and demographics can make open rates much better. Research by MailChimp shows that segmented campaigns have 14.31 percent more opens compared to ones that aren’t segmented. (Mailchimp)
• A recent Mailpro study showed that automated emails led to open rates of 51.36 percent. (Mailpro)
Industry open rates
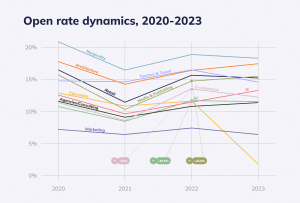
Open rates across all industries have been trending upwards, with an average increase of 7.6 percent from 2020 to 2023.
The Agencies/Consulting industry is in the lead with the biggest average growth in open rates at 8.1 percent over the four-year period. This is interesting considering the bounce rate problems we saw before.
The data suggests that open rates might be recovering after the COVID-19 shock of 2021. This is clear in the growth we saw in 2022 and 2023, with an overall 36.5 percent increase.
Media & Publishing had the biggest positive change of 50.6 percent from 2021, followed by E-commerce (+38.1 percent) and IT (+33.1 percent).
Open rate dynamics, 2020-2023
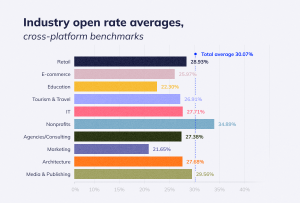
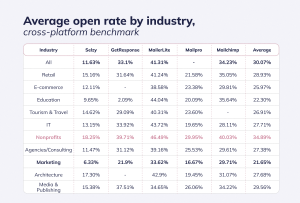
 Looking at benchmarks from different platforms, the overall average open rate is 30.07 percent. Nonprofits are in the lead with an open rate of 34.89 percent, while Marketing has the lowest open rate at 21.65 percent.
 Uncovering the value of unique open rates
Building on the overall open rate, the unique open rate is a more accurate way to measure how engaged each recipient is. It gets rid of duplicate counts by counting each unique recipient’s interaction with your email only once, no matter how many times they open it.
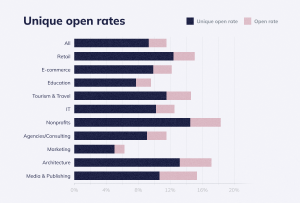 The overall open rate is still useful as a measure of engagement, but it’s important to look at it along with the unique open rate to get a more accurate idea of how each subscriber is behaving. Also, multiple opens aren’t necessarily bad. They might mean someone is really interested in your content.
Measuring engagement: Decoding email click-through rate
Click-through rate = (Unique clicks) / (Delivered emails). Looking beyond initial engagement, the email click-through rate (CTR) goes deeper, showing what percentage of recipients clicked on a link in your delivered emails. The CTR shows how many recipients were interested enough to click and learn more after opening your message.
The CTR gives you useful insights:
A high CTR means that recipients found the email content relevant and interesting enough to click and explore further.
A strong CTR suggests that your call to action (CTA) is clear, effective, and placed in a way that encourages recipients to do what you want.
Research by Mailсhimp shows that segmented email campaigns can outperform campaigns that aren’t targeted by 100.95 percent in terms of CTR. (Mailchimp) Dividing your audience into groups, tailoring content, and using CTAs can greatly boost engagement and click-through rates.
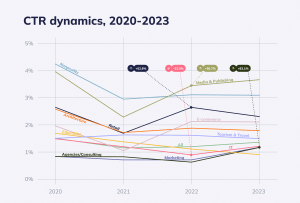 Industry benchmarks CTR dynamics through 2020-2023
Generally, open rates decreased by 8.6 percent over the four-year period, declining from 1.52 percent in 2020 to 1.39 percent in 2023. Overall, open rates went down by 8.6 percent over the four-year period, going from 1.52 percent in 2020 to 1.39 percent in 2023.
Looking at the period from 2021 to 2023 suggests that rates are also increasing, with +17.8 percent in 3 years.
In 2021 Media & Publishing open rates were affected the most (-1.7 percent), however, it experienced 60.8 percent growth from 2022 to 2023.
Education stands out as its open rates have been continuously declining from 2020, -33,8 percent in 4 years.
In 2023 Media & Publishing, Nonprofits, and Retail were the top industries in click-through rates, with 3.65 percent, 3.08 percent, and 2.51 percent respectively. Marketing (0.67 percent) and Education (0.92 percent) were the lowest performing.
Our cross-platform industry benchmark shows 2.14 percent as the click-through rate average. Media & Publishing is in the lead for CTR across industries with an average of 4.22 percent, followed by Nonprofits with 3.33 percent. Marketing and E-commerce have the lowest CTR averages of 1.61 percent and 1.99 percent consistently.
[Chart 12]
[Chart 13]
Unveiling unsubscribe rate stats
The Unsubscribe rate is the percentage of unsubscribes per delivery. The unsubscribe rate is the percentage of recipients who choose to opt out of your email list per delivered email, which can be good and bad. Unsubscription might seem like a bad thing at first, but you can still learn a lot from unsubscribe data. It’s normal to lose some people naturally. For example, businesses that target parents of young children might see people unsubscribe naturally as their target audience’s needs change. If you see a big jump in unsubscribes or complaints for specific emails or periods, it means you need to take action right away.
Research by Mailgun shows the top 3 reasons for unsubscribes:
• Getting too many emails – 19.8 percent
• Content is not relevant – 17.9 percent
• Content isn’t interesting – 17.3 percent (Mailgun)
[Chart 14]
Comparing unsubscribe rates across industries, 2020-2023
The overall average unsubscribe rate went down by 26.32 percent over the past 4 years. The industries with the lowest unsubscribe rates in 2023 were Marketing (0.09 percent) and Media & Publishing (0.11 percent). In 2023 Education (-35 percent) and Marketing (-35.7 percent) saw the biggest drop in unsubscribe rates. In Agencies/Consulting and IT industries, unsubscribe rates went up the most in 2023 by 26.7 percent and 13.3 percent.
[Chart 15]
In 2023 the overall unsubscribe rate average was 0.14 percent. The top 3 industries with the highest average unsubscribe rate:
Architecture – 0.74 percent
E-commerce – 0.55 percent
Marketing – 0.52 percent
Top 3 industries with the lowest unsubscribe rate:
Nonprofits – 0.21 percent
IT – 0.23 percent
Tourism & Travel – 0.23 percent
[Chart 16]
Understanding spam rates: Industry standards and comparison
Spam rate covers a crucial aspect – avoiding the spam folder. It indicates the percentage of recipients who mark emails as spam. Having emails marked as spam can be bad for email marketing efforts, affecting engagement, how much people trust your brand, and deliverability. Over 70 percent of consumers check their spam folders to see if important emails are missing, and almost 33 percent find it annoying when they find emails from brands in their spam folders. Ten percent of consumers lose trust in brands whose emails go to spam, which can make them unsubscribe. Almost 20 percent of consumers say they mark unwanted emails as spam, which can make mailbox providers take action against your sender’s reputation. (Mailgun)
[Chart 17]
Navigating spam folder: Spam rate by industry benchmarks, 2020-2023
The overall spam rate in 2023 was 0.05 percent, which is 44.4 percent lower than in 2020 when it was 0.09 percent. Education and Nonprofits saw the biggest decrease in spam rates in 2023, going down by 33.3 percent and 25 percent, while in Media & Publishing, spam rates went up by 33.3 percent. Media & Publishing has been having trouble with spam rates since 2021, with the industry’s spam rates doubling in three years.
E-commerce and Tourism & Travel spam rates stayed the same over four years at 0.04 percent and 0.03 percent. Agencies/Consulting’s spam rate was also pretty stable at 0.1 percent, but the industry is at risk because the spam rate should be below 0.1 percent.
After analyzing email benchmarks from Selzy and GetResponse, we found that the average overall spam rate is 0.03 percent. The lowest spam rate averages across industries were at 0.02 percent in four business sectors:
Retail
Travel & Tourism
Nonprofits
Marketing
Agencies & Consulting with 3.04 percent and Architecture with 2,93 percent have the highest spam rate averages across industries.
[Chart 19]
If a spam rate goes up a lot, mailbox providers will quarantine or block the messages. Even legitimate emails sent to real customers and subscribers who opted in earlier could end up in spam. In 2024, Gmail and Yahoo said they’ll start using spam complaint thresholds. People who send out a lot of emails need to keep spam rates below 0.1 percent consistently and avoid having big jumps of 0.3 percent.
Essential best practices and recommendations to elevate email marketing
The main reason for this study was to understand how to make email marketing better all the time. In this research, we looked at average email performance rates by industry between 2020 and 2023. The main finding is that people’s behavior changes because of changes in the digital, economic, and geopolitical environment. Because people can access information more easily, behaviour changes quickly, and small trends can be confusing. To keep up with things now, you need a lot of data, to be able to change quickly, and to stay on top of global trends and new things that companies and governments are doing.
This section explores advanced strategies to improve email marketing including automation, email acquisition, and the power of creativity.
Securing your reputation: Email authentication and spam policies
Mailbox providers measure how good your domain is. The better your reputation is, the more email services trust emails coming from your domain and put them in recipients’ inboxes. The system of points awarded is kept secret for safety reasons.
Mailbox providers have analytical tools called postmasters. They analyze deliverability, spam complaints, IPs, and domain reputations. Gmail, Outlook, Yahoo, and each popular mailbox provider has its postmaster. One of the most popular ones is Google Postmaster Tools which analyzes emails sent into Gmail mailboxes. (Selzy)
Major email providers like Google and Yahoo are making sending requirements stricter to improve the user experience and security. While they were considered best practices before, several requirements have become mandatory since 2024:
Email authentication: Use DKIM and DMARC protocols to verify your sender identity and stop people from pretending to be you.
“From” header compliance: Make sure the email address shown in the header matches your sending domain.
One-click unsubscribe: Include an easy and accessible unsubscribe option in every marketing email.
Track and manage spam: Keep spam report rates below 0.3 percent to avoid getting filtered and having deliverability problems. (Selzy)
2024 email authentication tips:
• Use a double opt-in process to reduce inactive and spam addresses on your list.
• Segment your audience based on how engaged they are so you can send them relevant content and keep a good sender reputation.
• Regularly remove inactive and low-engagement subscribers to make your email list better and improve deliverability.
• Combining authentication, anti-spam practices, and list management is essential for making your email campaigns work as well as possible.
Data-driven approach: Analytics for winning email marketing strategies
It’s getting more and more complicated to create a winning email strategy. Nowadays, people have more freedom to change their careers and goals throughout their lives and, at the same time, face the most destructive economic events. Changing social values and economic challenges are making people want flexibility and the ability to adapt to a changing world.
Relying just on demographic data like age, gender, and location isn’t enough anymore to predict what customers need and want. As people expect more personalized experiences, organizations need to adapt to this changing environment. Focusing on individuals and their journeys can lead to deeper engagement and better results.
Data has become the most important part of successful marketing strategies. The digital marketing software market was projected to have a 17.8 percent CAGR from 2020 to 2030 (Grand View Research). Useful insights from data analysis have gone from being a supporting element to being a mission-critical part of things.
Marketers are investing more in tools and technologies that combine data efficiently:
Customer relationship management (CRM) platforms are used by 90 percent of marketers. Sixty-two percent of marketers have adopted artificial intelligence (AI) to get insights from data and deliver personalized customer experiences on a large scale. Eighty-nine percent of B2B and B2B2C marketers use account-based marketing platforms (ABM) to create targeted campaigns that work with sales and service teams. (Salesforce)
This gives brands the power to understand individual preferences and behavior better., send targeted messages at the right time and through the right channels and tailor content and offers for each recipient, which makes engagement and conversions better.
Also, research from Litmus shows the big advantages of using third-party analytics tools. Companies that use third-party analytics:
• 15 percent more likely to measure conversions compared to companies that don’t use them.
• Have a 47 percent better chance of getting revenue per subscriber.
• Have a 42 percent higher probability of tracking subscriber lifetime value.
These findings mean a higher return on investment (ROI). Companies that use third-party analytics have an average ROI of 45:1, compared to 36:1 for those who don’t. Marketers with these tools see a 25 percent higher ROI than those without them. Despite the benefits, many companies struggle to use data effectively. Almost half (47 percent) don’t track email interactions beyond opens and clicks. Less than 20 percent measure their email marketing ROI. Only 12 percent track subscriber lifetime value. (Litmus).
[Chart 20]
Tips for data-driven email marketing strategy
Make decisions based on data. Explore third-party analytics platforms, CRM software with advanced reporting, and marketing automation solutions.
Watch key metrics: Don’t just track opens and clicks. Monitor conversions, revenue per subscriber, and subscriber lifetime value to maximize the impact of your campaigns and boost performance.
Train your team: Help your team get good at understanding and using data.
Collaborate: Ensure marketing and sales teams aim for the same goals and work together for a smooth customer experience. Companies that share email marketing results with all departments see a 28 percent higher ROI than those that don’t. (Litmus)
Making choices based on data and tech can dramatically change your email marketing efforts. Guessing isn’t an option anymore; a strategically driven powerhouse is the way to go. Data unlocks personalized experiences, boosts engagement, and gets better results.
Email marketing automation is growing rapidly
Building on the foundation of data-driven decision-making, here we look at how marketing automation makes email marketing even better. The global marketing automation industry is taking off and is expected to more than double from 2023 to 2030. A lot of companies are realizing how great automation is. About 60 percent of marketing leaders across the world are planning to spend more on automation. (Statista) Almost all marketers (98 percent) say that marketing automation is a must for success. (Adobe)
Automation has a lot of benefits, including:
• Making customer experience better.
• Helping staff work more efficiently.
• Getting better data and making better decisions.
• Boosting lead generation and making sure they stick around.
• Using the budget more wisely. (Mailmodo, Ascend2)
Email automation depends on data. 41 percent of email orders came from just 2 percent of automated emails in 2023. (Omnisend)
Automated emails do way better than regular campaigns:
Automated emails Traditional email campaigns
Open rates 42.1 percent 25.2 percent
Click rates 5.4 percent 1.5 percent
Conversion rates 1.9 percent 0.5 percent
Source: Omnisend
[Chart 21]
Automation isn’t just for e-commerce; it works in lots of different industries. Healthcare: Sending reminders for appointments and info about meds. Finance: Personalized investment reports and fraud warnings. Education: Custom learning paths and progress reports. Travel & Hospitality: Emails about canceled reservations, flight confirmations, and personalized recommendations based on past trips. Nonprofits: Trigger emails to track donations, volunteer sign-up confirmations, and personalized performance reports based on donations.
Lands’ End used first-party data (email activity, purchase history, browsing behavior, product interests) to make 15+ personalized trigger emails. This program had a 158 percent higher conversion rate (purchase per email click) than the industry average. Lands’ End mixes data with testing to figure out the best message frequency and volume. (Data Axle)
Automation can help make things easier, save money and make customers loyal. Expanding your reach: Strategic email acquisition. Email acquisition helps you grow your email lists and reach new people. A lot of people think you can’t use acquisition emails, but they’re totally legal when you use reputable partners who make sure people opt-in.
This is important because 23 percent of marketers didn’t know they could contact people not on their list via acquisition emails. (Data Axle)
[Chart 22]
Seventy-seven percent of marketers agree that acquisition emails give a higher return on investment. While 70 percent of marketers are focused on getting new customers, which shows how much potential email has. Combining email acquisition with other channels can make campaigns better. When you use email with other channels, like social media, engagement rates go up by 20 percent. Adding data tools to email acquisition can make your marketing even more efficient. Haven Life did a marketing campaign with a lookalike audience based on their existing customer data. They got 12 percent more quote forms completed and spent 23 percent less per lead than other platforms. (Data Axle)
By using acquisition emails and data-driven strategies, you can reach new customers and make your brand more well-known. Email acquisition helps grow email lists and reach new audiences. Contrary to misconceptions, acquisition email is 100 percent compliant with current privacy laws when using reputable partners who ensure opt-in consent for third-party solicitations.
Think outside the box: Embracing creativity in crafting engaging email campaigns. It’s tough to get people’s attention. Just speaking their language isn’t enough, you need to be creative. Virality is powerful, but real creativity is about finding the right balance between standing out and making people feel comfortable. It’s always been hard to stand out from the crowd, but now it feels more important than ever. People want something new and interesting. No matter what industry you’re in, you need to get creative to stand out from the crowd.
Customers are used to boring stuff, so it’s a great chance for brands to do something different. But companies that focus on performance and budgets often don’t take creative risks. This can lead to lower-quality work that’s all about data, and not human imagination and touch. (Accenture). Many brands have sacrificed quality for speed, focusing on efficiency over creative impact. But bringing back craft, playfulness, and attention to detail will lead to long-term success.
Examples from the real world:
Far Cry 6 email: Selzy’s blog talks about this unusual email that went viral on Reddit with 4.5k upvotes. It shows how creative approaches can be really powerful. (Selzy)
Brands like Jacquemus and Maybelline add fun elements to surprise and engage their audience. They make content that starts conversations and shows off their playful personalities.
Home security brand Ring used the “alien confirmation” news to have a contest to see who could capture aliens on their cameras. It shows how embracing disruptive things within your niche can lead to unexpected engagement and brand awareness. (We are social)
Creativity doesn’t have to be over-the-top. It can be subtle, fun, or just unexpected. By taking calculated risks and experimenting with creative approaches, you can make your email marketing more engaging and successful.
Selzy is an ecosystem of marketing automation tools that helps small and medium businesses grow. The firm’s mission is to make intelligence-driven marketing technologies affordable and accessible to companies of all sizes and segments. They believe that every business deserves an equal opportunity to grow and to thrive.
Related Posts